Pressured By Rising US Bond Yields Ahead Of FOMC Decision")
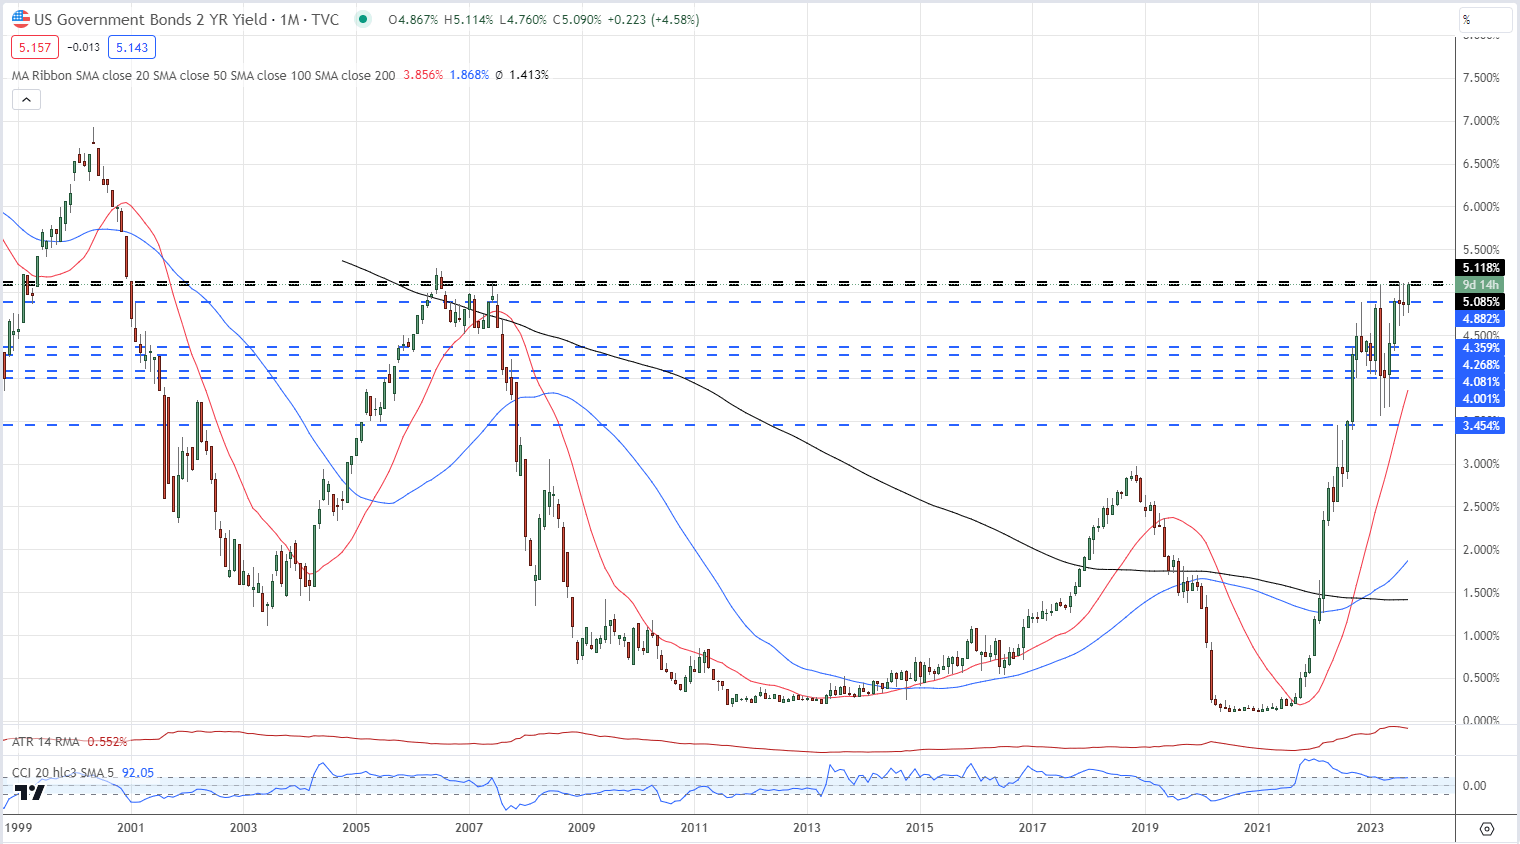
US Treasury yields are pressing against multi-year highs as markets continue to price in higher inflation expectations. The UST 2yr is within a handful of basis points of levels last seen in mid-2006, while the 10yr benchmark yesterday hit levels last seen in November 2007. The recent push higher in oil prices is helping to fuel the inflation narrative, while traders are also pricing in a hawkish hold by the Federal Reserve later today. In addition, market participants are also demanding more yield for their money in the face of the increased US Treasury issuance this year. The US Treasury last week sold around $103 billion of longer-term US Treasuries, placing upward pressure on UST yields.
US TREASURY 2YR YIELDS MONTHLY CHART
US TREASURY 10YR YIELDS MONTHLY CHART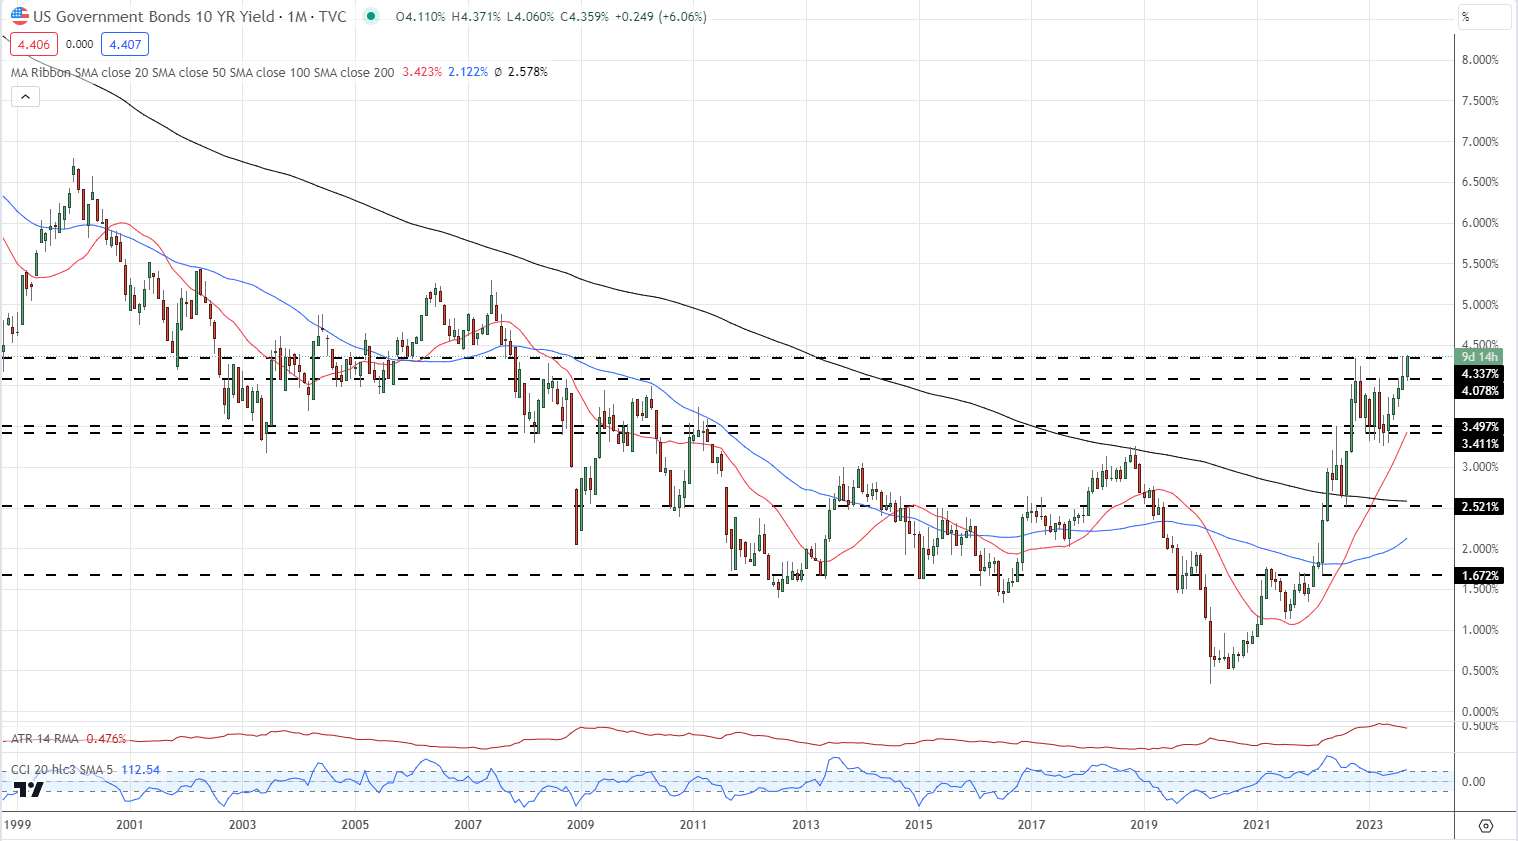
The Federal Reserve is fully expected to keep interest rates unchanged (525-550) at their latest policy meeting later today. The focal point of today’s meeting will be the post-decision press conference and the latest Summary of Economic Projections or dot plot. This chart shows where each FOMC voting member thinks that interest rates will be over the coming years. The dot plot is closely watched by traders for clues in the Fed's overall thinking on interest rates.
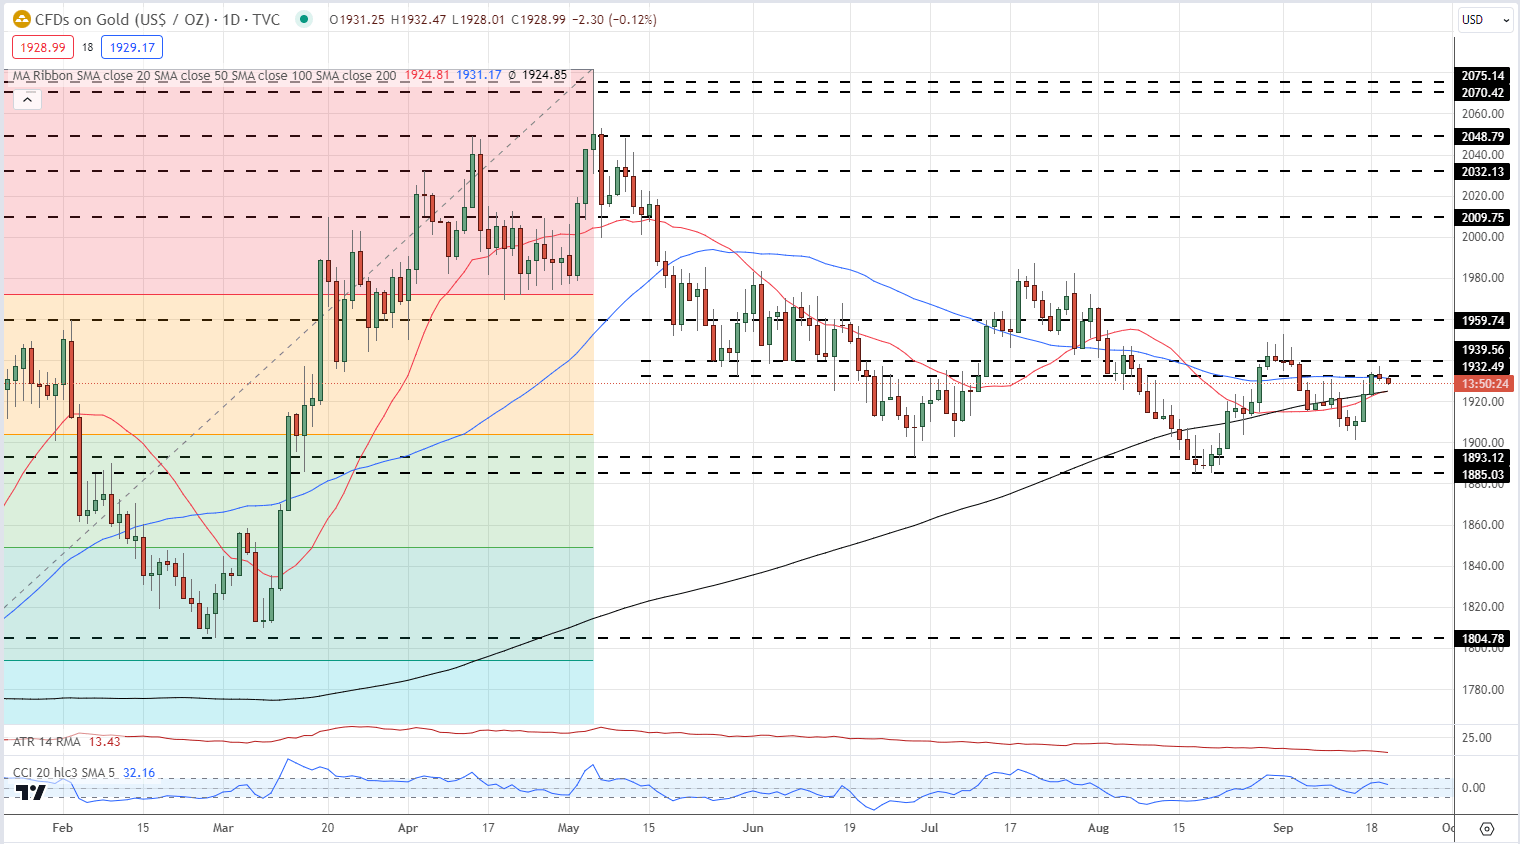
Gold is struggling against the current backdrop with a prior zone of resistance between $1,932/oz. and $1,940/oz. proving difficult to overcome. All three simple moving averages are also clustered just below this area - $1,924/oz. to $1,931/oz. – adding to the mixed outlook. If gold breaks below these moving averages then $1,900/oz. is the next target ahead of $1,893/oz. and $1,885/oz.
GOLD DAILY PRICE CHART – SEPTEMBER 20, 2023